Key Takeaway
When an embedded Linux process crashes with a Segmentation fault (SIGSEGV), you can inspect the post-mortem state by opening the core dump in gdb alongside the matching symbol-bearing binary and running bt to find where it died, or debug it live by running gdbserver on the board and connecting from the host PC via target remote board-ip:port. Because gdbserver has no built-in security of its own, it must only ever be used on an isolated private network.
When a program on an embedded board crashes with a plain Segmentation fault, console output alone rarely reveals which line or variable caused the issue. This guide walks through two practical ways gdb pinpoints the root cause — post-mortem core dump analysis and live gdbserver remote debugging — backed by verbatim output from building and running a minimal crash example.
How Do You Find Where a Crashed Program Died Using a Core Dump?
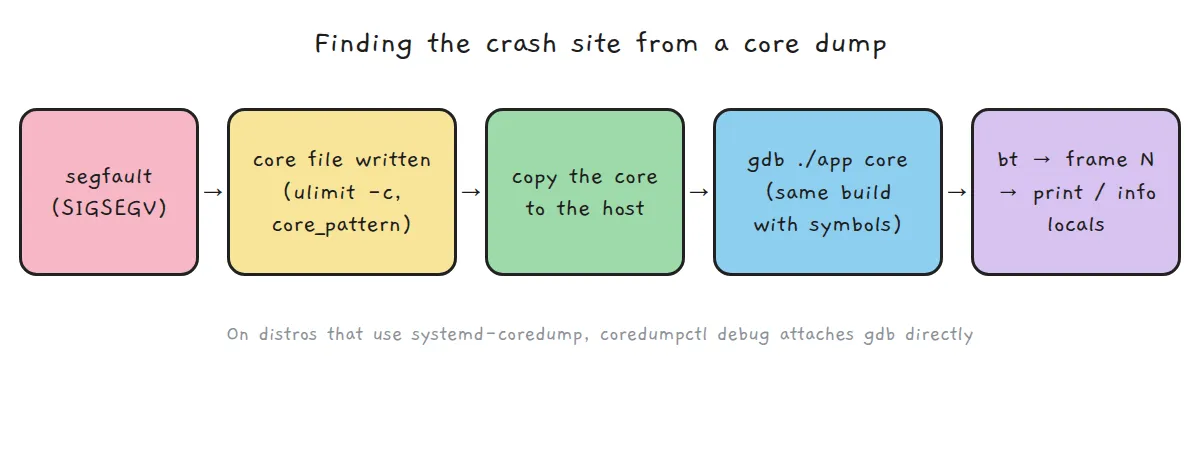
One-line answer: Enable core file generation, open the core file together with the matching symbol-bearing binary in gdb, and run bt to locate the crash point.
-
On Linux, when a process terminates abnormally — for instance with a Segmentation fault (SIGSEGV, signal 11) — the operating system can write out the process’s memory state at that moment as a file; this is a core dump. For a core file to be generated, the shell’s resource limit
ulimit -cmust be nonzero; percore(5), anRLIMIT_COREvalue of 0 prevents any core file from being written. Where the core file is stored and how it is named is governed by the kernel parameter/proc/sys/kernel/core_pattern, whose default value iscore;%specifiers are substituted, and a leading|pipes the core to a specified user-space program. On systemd-based distributions,systemd-coredumparchives cores in the journal, so runningcoredumpctl debugattaches a debugger (gdb by default) directly to the latest crash’s core dump. -
The essential prerequisite for core dump analysis is having the exact same build binary with debug symbols (
-g). Embedded boards have limited flash and RAM, so you will often deploy stripped binaries to the target, but the development host PC must preserve the symbol-bearing binary from that exact build. For the basics of gdb’sbreak,run, andprintcommands, refer to gdb basics (Korean) — they are not repeated here. For detecting memory corruption earlier in development, tools like AddressSanitizer (ASan) (Korean) can also be used. -
Here is a minimal C example that crashes by leaving a sensor struct’s buffer pointer unallocated and then writing through the resulting NULL pointer:
/* A tiny example that deliberately writes through a NULL pointer */
#include <stdio.h>
#include <string.h>

struct sensor {
    const char *name;
    int *buf;
};

static void fill(struct sensor *s, int n) {
    for (int i = 0; i < n; i++)
        s->buf[i] = i * 10;          /* crashes here when buf is NULL */
}

int main(void) {
    struct sensor s = { "temp", NULL };   /* forgot to allocate the buffer */
    printf("start: %s\n", s.name);
    fflush(stdout);
    fill(&s, 4);
    printf("done\n");
    return 0;
}
The code builds cleanly with gcc -g -O0 -Wall -Wextra crash.c -o crash (producing no warnings). Below is the verbatim output from a real run on an x86_64 box. It was run from a root shell after ulimit -c unlimited as ./crash; echo exit=$?; the second line is bash’s own message, and the PID differs on every run.
start: temp
bash: line 1: 2774473 Segmentation fault      (core dumped) ./crash
exit=139
Right after printing start: temp, the shell reports Segmentation fault (core dumped) and the process terminates with exit code 139 (128 + SIGSEGV). On this x86_64 box, the unprivileged user’s hard core-size limit was 0, so ulimit -c unlimited was applied as root, and this box’s core_pattern was configured as /tmp/core.%e.%p.%t (target boards may configure this path differently).
- Once a core file is generated, you can open it alongside the binary using
gdb ./crash core.crash(per theInvoking GDBmanual), or executecore-file core.crashfrom within the gdb prompt (Commands to Specify Files). Below is the output from a real run on this x86_64 box; memory addresses change on every run due to ASLR.
[New LWP 2774771]
[Thread debugging using libthread_db enabled]
Using host libthread_db library "/lib/x86_64-linux-gnu/libthread_db.so.1".
Core was generated by `./crash'.
Program terminated with signal SIGSEGV, Segmentation fault.
#0  fill (s=0x7ffc343d1340, n=4) at crash.c:12
12	        s->buf[i] = i * 10;          /* crashes here when buf is NULL */
#0  fill (s=0x7ffc343d1340, n=4) at crash.c:12
#1  0x00005571df2641f7 in main () at crash.c:19
#0  fill (s=0x7ffc343d1340, n=4) at crash.c:12
12	        s->buf[i] = i * 10;          /* crashes here when buf is NULL */
$1 = {name = 0x5571df265004 "temp", buf = 0x0}
$2 = (int *) 0x0
$3 = 0
#1  0x00005571df2641f7 in main () at crash.c:19
19	    fill(&s, 4);
s = {name = 0x5571df265004 "temp", buf = 0x0}
Running bt (Backtraces) reveals the call stack #0 fill → #1 main () at crash.c:19. Selecting frame 0 (Selecting a Frame) and inspecting print *s confirms that buf = 0x0 (a NULL pointer). print i yields 0, demonstrating that the failure occurred on the very first loop iteration, while inspecting frame 1 with info locals (Information About a Frame) confirms that main passed s in that same unallocated state.
- If the crash reproduces reliably in a local environment, you can skip writing a core file to disk entirely and run
gdb -batch -ex run -ex bt ./crashto dump the backtrace immediately. Below is the output from a real run on the same x86_64 box; addresses will differ on each run.
[Thread debugging using libthread_db enabled]
Using host libthread_db library "/lib/x86_64-linux-gnu/libthread_db.so.1".
start: temp

Program received signal SIGSEGV, Segmentation fault.
fill (s=0x7fffffffe170, n=4) at crash.c:12
12	        s->buf[i] = i * 10;          /* crashes here when buf is NULL */
#0  fill (s=0x7fffffffe170, n=4) at crash.c:12
#1  0x00005555555551f7 in main () at crash.c:19
The program halts immediately upon receiving SIGSEGV and outputs the backtrace to stdout, making this pattern ideal for quick verification in local shells or CI pipelines.
How Do You Remote-Debug a Board Program From the Host PC With gdbserver?
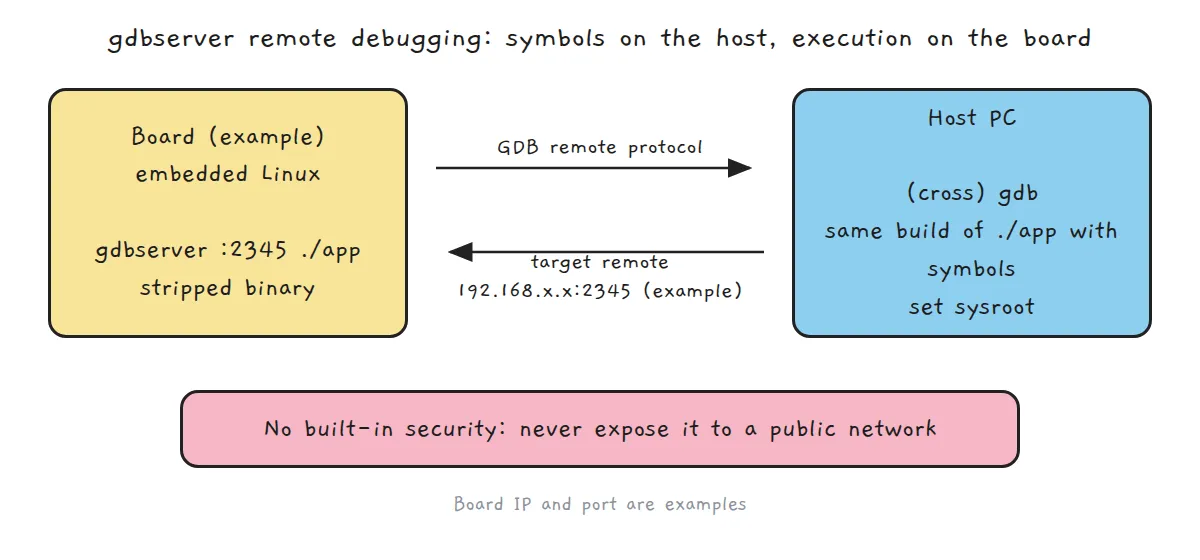
One-line answer: Run gdbserver on the target board to host the program, then connect from (cross-)gdb on the host PC using target remote board-ip:port for interactive remote debugging.
-
The board and host PC have cleanly separated responsibilities. The target board runs only the lightweight
gdbserverdaemon, which manages process execution and proxies memory accesses. The official GDB manual (Server.html) explains: “gdbserver does not need your program’s symbol table, so you can strip the program if necessary to save space. GDB on the host system does all the symbol handling.” Because gdbserver does not require symbol tables, binaries deployed to the board can be fully stripped to save space, leaving DWARF symbol resolution and source-line mapping entirely to GDB on the host. -
gdbserver Security Warning (verbatim from the official GDB manual)
“gdbserver does not have any built-in security. Do not run gdbserver connected to any public network; a GDB connection to gdbserver provides access to the target system with the same privileges as the user running gdbserver.”
gdbserver provides neither authentication nor transport encryption. Anyone who connects to an open gdbserver port inherits the exact privileges of the user who launched it. Consequently, gdbserver must never be exposed to public networks, but restricted strictly to isolated private networks or point-to-point host-target links (Using the gdbserver Program).
- Here is the standard connection workflow between board and host. All commands below are examples; specific ports and IP addresses depend on your setup.
Target board execution (example):
# Example (board side, 2345 is an example port)
gdbserver :2345 ./app
Port 2345 is an example port. According to the manual, you can pick any number as long as it does not conflict with a TCP port already in use on the target, and the host part of a host:2345 argument is currently ignored.
Host PC execution (example):
In a cross-architecture environment, use <toolchain-prefix>-gdb (such as the generic example aarch64-linux-gnu-gdb) or the multi-architecture package gdb-multiarch rather than the host’s native gdb. For setting up cross-compilation environments, see aarch64 cross-compilation with CMake.
# Example (host side, 192.168.x.x is an example IP)
gdb-multiarch
(gdb) file ./app
(gdb) set sysroot <path to a local copy of the target root filesystem>
(gdb) target remote 192.168.x.x:2345
(gdb) continue
Use file ./app to load the symbol-bearing binary on the host, and set sysroot (Commands to Specify Files) to point to the target shared library symbols. In target remote 192.168.x.x:2345 (Connecting to a Remote Target), 192.168.x.x represents the target board’s example IP address. Executing continue resumes target execution until a crash occurs, at which point bt reveals the stopping location.
- On this same x86_64 box rather than an actual board, stripped-binary execution was verified over local loopback (
localhost:2345) (“a real run on an x86_64 box”). The symbol-bearing binary (crash) measured 18,848 bytes, while the stripped binary (crash.stripped) measured 14,488 bytes. Runningnm crash.strippedoutputnm: crash.stripped: no symbols, verifying that symbols were completely removed.
Here is the output from the gdbserver side (acting as the board on the same box), from a real run on the x86_64 box; the PID and the connecting client port vary across runs.
Process ./crash.stripped created; pid = 2774988
Listening on port 2345
Remote debugging from host ::1, port 58268
start: temp
And here is the output from the host gdb side connecting via target remote localhost:2345, also from a real run on the x86_64 box; memory addresses vary across runs.
Reading /lib64/ld-linux-x86-64.so.2 from remote target...
warning: File transfers from remote targets can be slow. Use "set sysroot" to access files locally instead.
Reading /lib64/ld-linux-x86-64.so.2 from remote target...
0x00007ffff7fe42c0 in ?? () from target:/lib64/ld-linux-x86-64.so.2
Reading /lib/x86_64-linux-gnu/libc.so.6 from remote target...

Program received signal SIGSEGV, Segmentation fault.
fill (s=0x7fffffffe200, n=4) at crash.c:12
12	        s->buf[i] = i * 10;          /* crashes here when buf is NULL */
#0  fill (s=0x7fffffffe200, n=4) at crash.c:12
#1  0x00005555555551f7 in main () at crash.c:19
The warning warning: File transfers from remote targets can be slow. Use "set sysroot" to access files locally instead. highlights the latency of streaming shared libraries over the network from the remote target, demonstrating why configuring a local copy with set sysroot is vital. Furthermore, even though the server executed crash.stripped with zero debug symbols, the host gdb successfully reconstructed the crash point as fill (...) at crash.c:12 using its local symbol file.
What Should You Check When bt Shows ?? or No Line Numbers?
One-line answer: Verify, in order, whether -g debug symbols were compiled in, whether host and target binaries and libraries match (set sysroot), and whether compiler optimization (-O2) eliminated frames or variables.
-
Corrupted or uninformative backtraces typically stem from one of five root causes:
- Binary mismatch between host and board: Loading a binary rebuilt from even slightly modified sources causes line numbers and memory offsets to diverge from the running target, leading to misaligned line references or symbol resolution failures. Verify that the ELF’s
.note.gnu.build-idhash matches between host and target binaries. - Missing
-gcompilation flag: Without-g, no DWARF debug information is generated. While global function names may still resolve from ELF symbol tables, source filenames and line numbers will not be shown. - Incorrect
set sysrootor shared library paths: When a crash occurs inside a shared library and host gdb cannot locate matching symbols, frames appear as0x... in ?? () from target:/lib/.... Runinfo sharedlibraryto verify symbol loading, and specifyset sysroot <target rootfs path>orset solib-search-path <path>if entries are missing (Commands to Specify Files). - Target architecture mismatch: Attempting to analyze another architecture’s core file or gdbserver session using the host’s native x86_64 gdb fails because register frames cannot be parsed. Always use
<toolchain-prefix>-gdborgdb-multiarchinstead. - Compiler optimization side effects: Under
-O2or-O3, functions may be inlined out of the call stack, and variables may be register-allocated or omitted, showing up as<optimized out>when evaluated withprint. Compile with-O0whenever feasible during debugging.
- Binary mismatch between host and board: Loading a binary rebuilt from even slightly modified sources causes line numbers and memory offsets to diverge from the running target, leading to misaligned line references or symbol resolution failures. Verify that the ELF’s
-
In summary: for intermittent field failures, collecting the core dump alongside the release’s matching symbol binary and running post-mortem analysis via
gdb ./app coreon the host is most practical. For reproducible issues, starting gdbserver on the board and attaching remotely from the host allows rapid, live inspection of breakpoints and variable transitions.
[Interview one-liner] Even when deploying stripped binaries to embedded boards, preserving matching symbol binaries (verified by Build ID) on the host PC enables post-mortem core dump analysis via gdb ./app core or live remote debugging via gdbserver and target remote, pinpointing the crash line with bt either way.
Interview answer template: “When an embedded Linux application crashes with SIGSEGV, engineers rely on two core strategies: post-mortem core dump analysis and live remote debugging with gdbserver. Even if storage constraints require deploying stripped binaries to the target, keeping a symbol-bearing (-g) binary from the exact same build alongside a local copy of the target root filesystem (set sysroot) on the host PC allows you to reconstruct the call stack (bt) and inspect variable values accurately. Because gdbserver lacks built-in authentication and encryption, it must strictly be restricted to isolated private networks rather than exposed to public environments.”
What Questions Come Up Most Often in Real Debugging Sessions?
Q1. A Segmentation fault occurred, but no core dump file was produced. What should I check?
A1. First, check the shell’s ulimit -c setting. If set to 0, no core file will be generated; set it with ulimit -c unlimited. Next, confirm that the directory defined in /proc/sys/kernel/core_pattern actually exists and has write permissions. On systemd-based installations, core files may be captured directly into the journal, so inspect coredumpctl list and coredumpctl debug.
Q2. I ran target remote 192.168.x.x:2345 from the host PC to connect to gdbserver, but the connection fails or times out.
A2. First, verify whether the target board’s firewall permits incoming traffic on that port (port 2345 above is an example port). Next, check that gdbserver on the board printed Listening on port 2345 and is still waiting, and that no other service is using that port. Finally, test basic host-to-target network connectivity, such as with ping.
Q3. When debugging a crash, when should I reach for strace versus gdb?
A3. strace (Korean) monitors system-call boundaries between user space and the Linux kernel, making it ideal for diagnosing missing files, permission errors, or shared library loading failures. Conversely, gdb (via core dump analysis or gdbserver) inspects internal process memory, execution call stacks, local variables, and invalid pointer dereferences down to the individual line of code. Use strace to determine ‘which system call failed,’ and gdb to determine ‘which line of code accessed which memory address incorrectly.’
Where Can You Verify What This Post Says?
- GDB manual: Using the gdbserver Program
- GDB manual: Connecting to a Remote Target
- GDB manual: Commands to Specify Files
- GDB manual: Backtraces
- GDB manual: Selecting a Frame
- GDB manual: Information About a Frame
- GDB manual: Invoking GDB
- Linux kernel docs: core_pattern
- core(5) man page
- coredumpctl(1) man page
All outputs are real runs on an x86_64 box (gcc 14.2.0, GNU gdb and gdbserver 16.3). Board-side commands and 192.168.x.x are examples.