Key Takeaway
Temperature and top-p are parameters that control how an LLM picks its next token. The model outputs a probability distribution over the next token; temperature adjusts the shape of that distribution, while top-p and top-k control the range of candidates. As a result, when sampling is used, the same question can produce a different answer.
This post is part of my AI study notes series as I prepare for the SK hynix AI Hackathon preliminary round (Oct 17–18). Following the inference process covered earlier, today’s post looks at how an actual token gets selected based on the output probability distribution.
How Does an LLM Pick the Next Token? The Difference Between Greedy and Sampling
One-line answer: The model outputs a probability distribution over the next token, and a separate rule (the decoding strategy) decides what actually gets picked from it.
- The model outputs a probability distribution over the next token, and a separate rule (the decoding strategy) decides what gets picked from it.
- The decode stage generates one token at a time, so this “picking” happens at every single step (see the Day3 decode process post for details).
- Greedy: always picks the token with the highest probability. It’s consistent, but can be repetitive and monotonous.
- Sampling: draws a token at random, in proportion to its probability. This is why the same question can produce a different answer every time.
What Is Temperature? The Principle Behind Sharpening or Flattening the Probability Distribution
One-line answer: It divides the score (logit) by T before Softmax, controlling how sharp or flat the resulting probability distribution becomes.
- The score (logit) is divided by T before being passed into Softmax (the Softmax concept itself is covered in the Day1 Self-Attention post, so it isn’t re-explained here). As a formula, this is p_i = softmax(z_i / T).
- Lowering T (closer to 0) makes the distribution sharper. Probability concentrates on the top token, moving closer to greedy behavior.
- Raising T makes the distribution flatter. This allows for more varied phrasing, but also increases the chance of an off-base answer.
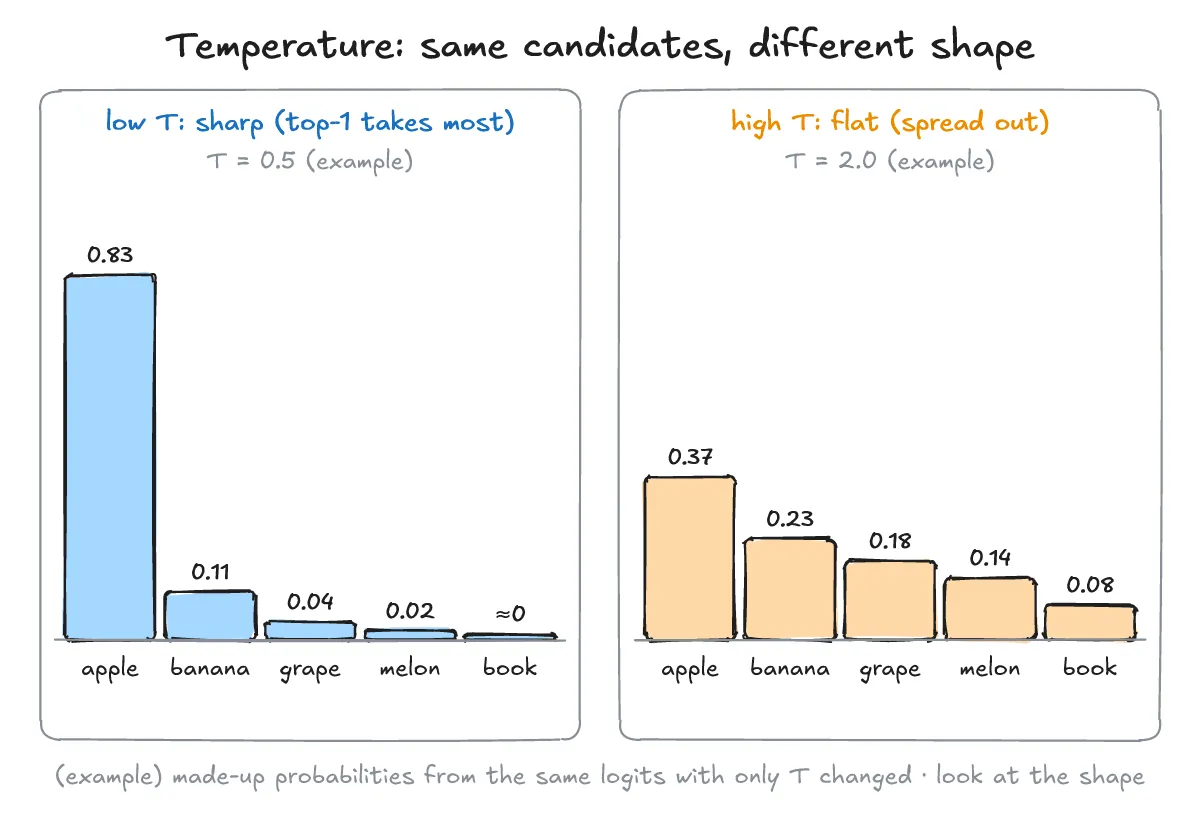
- Example (illustrative, made-up values): using arbitrarily chosen logits of 2.0/1.0/0.5/0/-1.0, the probabilities come out to roughly 0.83/0.11/0.04/0.02/0.00 at low T (0.5), and roughly 0.37/0.23/0.18/0.14/0.08 at high T (2.0). These numbers aren’t from a real model — they’re illustrative (example) values meant only to show how the shape of the distribution changes. That said, at T=0 (or greedy) the answer is usually nearly identical, but depending on implementation and batching, small differences can occur, so it can’t be said to “always” be the same.
Top-k vs Top-p: When Should You Lower Which for Accurate vs Creative Answers?
One-line answer: Top-k fixes the number of candidates, while top-p keeps a flexible set of candidates until the cumulative probability reaches p.
- Top-k: keeps only the top k highest-probability candidates and samples from within that set.
- Top-p (nucleus sampling): keeps the smallest set of candidates, ordered by probability, whose cumulative probability reaches at least p, then samples from within that set (source: Holtzman et al., 2019, “The Curious Case of Neural Text Degeneration”).
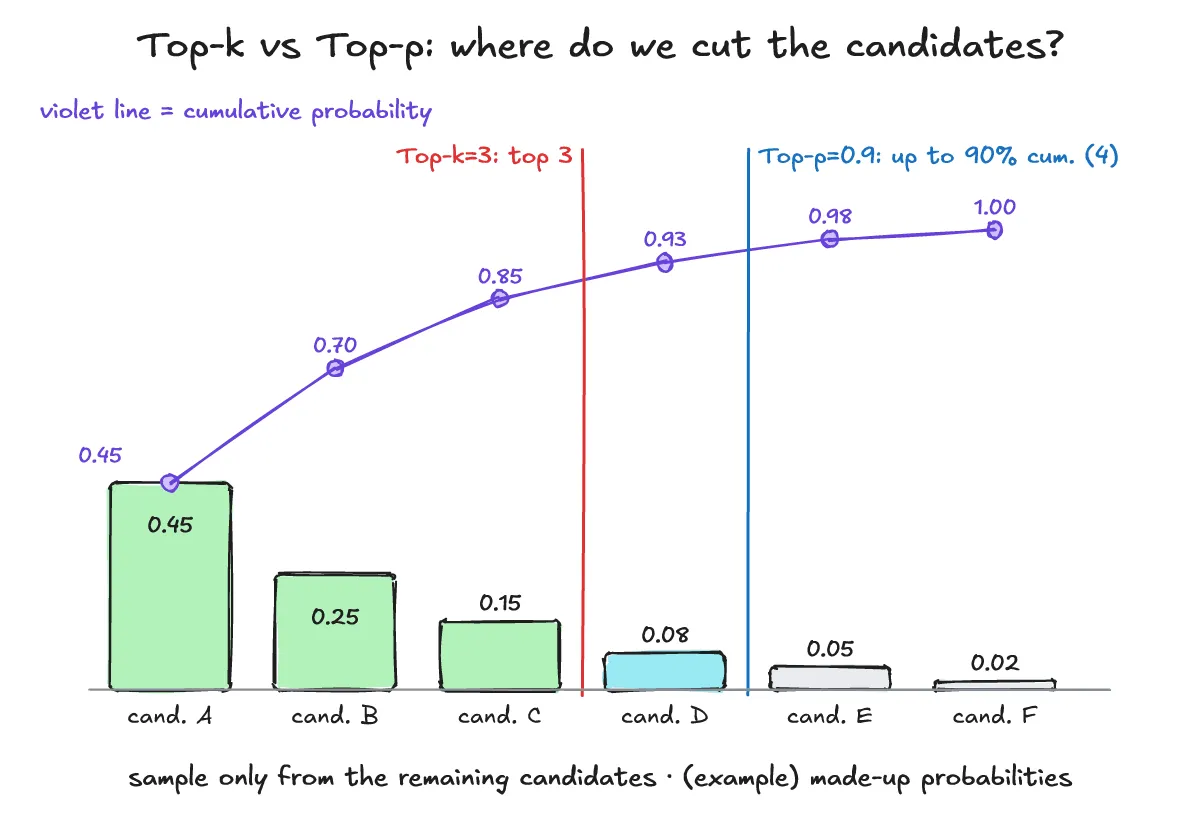
- The difference: k fixes the number of candidates, while p lets the candidate count grow or shrink depending on the shape of the distribution (fewer candidates when the distribution is sharp, more when it’s flat). As an example (illustrative values), if the probabilities are 0.45/0.25/0.15/0.08/0.05/0.02, top-k=3 keeps the top 3, while top-p=0.9 keeps the top 4, where the cumulative probability reaches 0.93.
- Practical guide (qualitative): for answers where accuracy matters, like code or factual responses, set temperature or top-p lower; for cases needing diversity, like idea generation or creative writing, set them higher.
- Generally, it’s more common to adjust only one of temperature or top-p rather than changing both significantly at the same time.
[Exam one-liner] Temperature = shape of the distribution (sharp/flat); top-k/top-p = range of candidates (count/cumulative probability); lowering them makes answers more consistent and accurate, raising them makes them more diverse.
Shall We Test What We’ve Learned With a Quiz?
Q1. How can you make a model produce nearly the same answer for the same prompt every time?
A1. Set temperature close to 0 (or use greedy decoding), or restrict candidates with something like top-k=1. That said, small differences can still occur depending on the implementation or environment.
Q2. When top-p=0.9, is the number of token candidates the model outputs always the same?
A2. No. With top-p, the number of candidates changes dynamically based on the shape of the distribution. A sharp distribution leaves fewer candidates, while a flat one leaves many more.
Q3. How does the probability distribution change as temperature increases?
A3. The distribution becomes flatter, so candidate tokens that previously had low probability also become more likely to be picked, resulting in more varied answers.
Input-side design (prompts) is covered in the Day4 prompt engineering post.