Summary
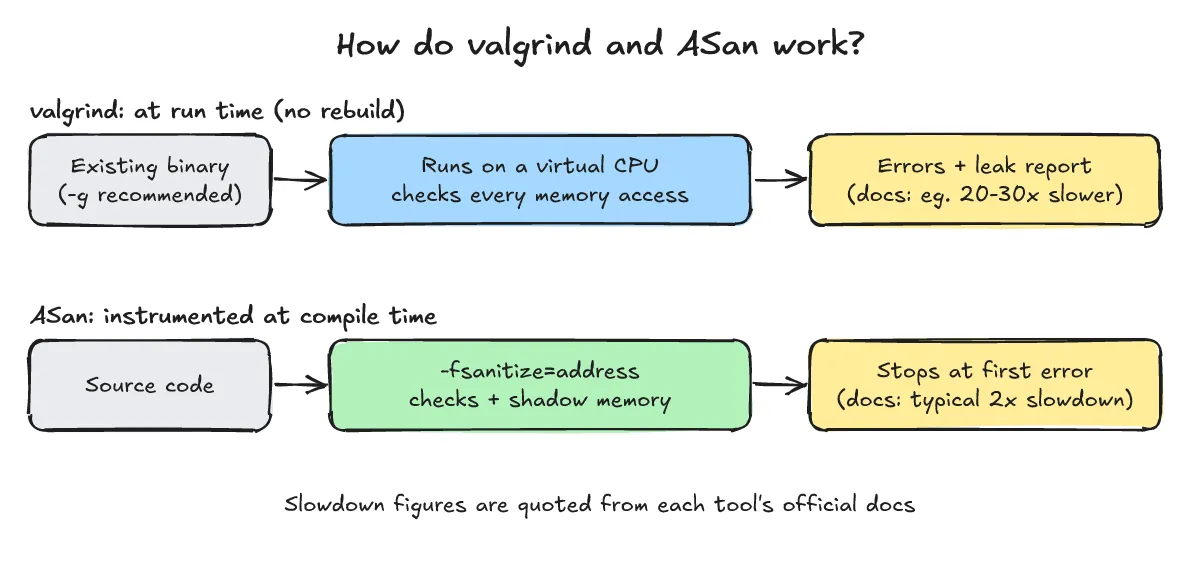
valgrind (with its default tool, Memcheck) runs an existing binary without recompilation to detect memory leaks (definitely / indirectly / possibly lost), use of uninitialised values, invalid reads/writes, and bad frees (building with -g -O0 is recommended for accurate line numbers). Because valgrind slows execution so that your program runs roughly 20 to 30 times slower than normal (Valgrind Quick Start Guide), use compile-time AddressSanitizer (ASan, -fsanitize=address)—which has a typical slowdown of 2x (Clang AddressSanitizer docs)—during regular development builds, and reach for valgrind when you cannot recompile or when you need uninitialised-value origin tracking (--track-origins=yes) and a complete leak summary in a single run.
What is valgrind, and what does Memcheck detect?
One-line answer: Memcheck, the default tool in valgrind, runs your existing binary without recompilation to catch invalid reads and writes, use of uninitialised values, memory leaks, and bad frees.
- Default tool Memcheck and build flags: Running
valgrindinvokes Memcheck by default. As noted in the Valgrind Quick Start Guide, it works directly on an existing binary with no recompile required, though building with-g(and-O0recommended for accurate lines) lets Memcheck point to exact source files and line numbers. - What Memcheck catches:
- Invalid reads and writes: Out-of-bounds accesses on heap blocks and invalid pointer dereferences.
- Use of uninitialised values: Conditional jumps or moves that depend on uninitialised variables. Passing
--track-origins=yes“makes Memcheck run slower” (Memcheck manual) but pinpoints where the uninitialised value came from. - Memory leaks: Heap blocks left allocated at program exit, grouped by loss category.
- Bad frees: Invalid or mismatched deallocations.
- If you want to pause execution interactively at a crash site to inspect variables and the call stack, see our gdb debugging guide.
In what order do you find memory leaks with valgrind?
One-line answer: Build with -g -O0, run valgrind --leak-check=full --track-origins=yes ./your_binary, and read the runtime error stack traces followed by the four categories in the LEAK SUMMARY.
Step 1: Build with -g -O0 and run valgrind
Actual output (Debian, gcc 14.2.0, valgrind-3.24.0)
$ gcc -g -O0 -o leak leak.c
$ valgrind --leak-check=full --track-origins=yes ./leak
Step 2: Test code (leak.c)
This leak.c sample triggers a direct leak (definitely lost), an indirect leak (indirectly lost), a branch on an uninitialised stack variable, and a heap out-of-bounds write.
#include <stdio.h>
#include <stdlib.h>
#include <string.h>

struct node { char *name; };

int main(void) {
    char *a = malloc(16);              /* never freed -> definitely lost */
    strcpy(a, "hello");

    struct node *n = malloc(sizeof *n); /* pointer dropped -> definitely lost */
    n->name = malloc(32);               /* only reachable via n -> indirectly lost */

    int x;                              /* uninitialised */
    if (x > 0) puts("positive");

    int *arr = malloc(4 * sizeof *arr);
    arr[4] = 1;                         /* invalid write, 1 past end */
    free(arr);

    a = NULL; n = NULL;
    return 0;
}
Step 3: Inspect the Memcheck output
Actual output (Debian, gcc 14.2.0, valgrind-3.24.0; process ID replaced with PID)
==PID== Memcheck, a memory error detector
==PID== Copyright (C) 2002-2024, and GNU GPL'd, by Julian Seward et al.
==PID== Using Valgrind-3.24.0 and LibVEX; rerun with -h for copyright info
==PID== Command: ./leak
==PID==
==PID== Conditional jump or move depends on uninitialised value(s)
==PID==    at 0x1091A5: main (leak.c:15)
==PID==  Uninitialised value was created by a stack allocation
==PID==    at 0x109159: main (leak.c:7)
==PID==
==PID== Invalid write of size 4
==PID==    at 0x1091CC: main (leak.c:18)
==PID==  Address 0x4a5e150 is 0 bytes after a block of size 16 alloc'd
==PID==    at 0x4844818: malloc (vg_replace_malloc.c:446)
==PID==    by 0x1091BF: main (leak.c:17)
==PID==
==PID==
==PID== HEAP SUMMARY:
==PID==     in use at exit: 56 bytes in 3 blocks
==PID==   total heap usage: 4 allocs, 1 frees, 72 bytes allocated
==PID==
==PID== 16 bytes in 1 blocks are definitely lost in loss record 1 of 3
==PID==    at 0x4844818: malloc (vg_replace_malloc.c:446)
==PID==    by 0x10916A: main (leak.c:8)
==PID==
==PID== 40 (8 direct, 32 indirect) bytes in 1 blocks are definitely lost in loss record 3 of 3
==PID==    at 0x4844818: malloc (vg_replace_malloc.c:446)
==PID==    by 0x109188: main (leak.c:11)
==PID==
==PID== LEAK SUMMARY:
==PID==    definitely lost: 24 bytes in 2 blocks
==PID==    indirectly lost: 32 bytes in 1 blocks
==PID==      possibly lost: 0 bytes in 0 blocks
==PID==    still reachable: 0 bytes in 0 blocks
==PID==         suppressed: 0 bytes in 0 blocks
==PID==
==PID== For lists of detected and suppressed errors, rerun with: -s
==PID== ERROR SUMMARY: 4 errors from 4 contexts (suppressed: 0 from 0)
Step 4: How to read the report and the four leak kinds
- Two runtime memory errors:
leak.c:15: ReportsConditional jump or move depends on uninitialised value(s)forx, and because--track-origins=yeswas enabled, traces its origin to the stack allocation inmain (leak.c:7).leak.c:18: ReportsInvalid write of size 4located0 bytes after a block of size 16 alloc'datleak.c:17.
- Leak records:
16 bytes in 1 blocks are definitely lost: The bufferaallocated atleak.c:8.40 (8 direct, 32 indirect) bytes in 1 blocks are definitely lost: The 8-bytestruct nodeallocated atleak.c:11is directly lost, and its 32-byten->namebuffer is indirectly lost along with it.
- The four LEAK SUMMARY kinds (Memcheck manual):
definitely lost: No pointer to the block remains anywhere—fix these first.indirectly lost: The block is only reachable through another lost block—freeing the root block resolves these automatically.possibly lost: Only interior pointers (pointing into the middle of the block rather than its start) remain.still reachable: A pointer to the start of the block still exists at exit.
How do valgrind and ASan differ, and when should you use each?
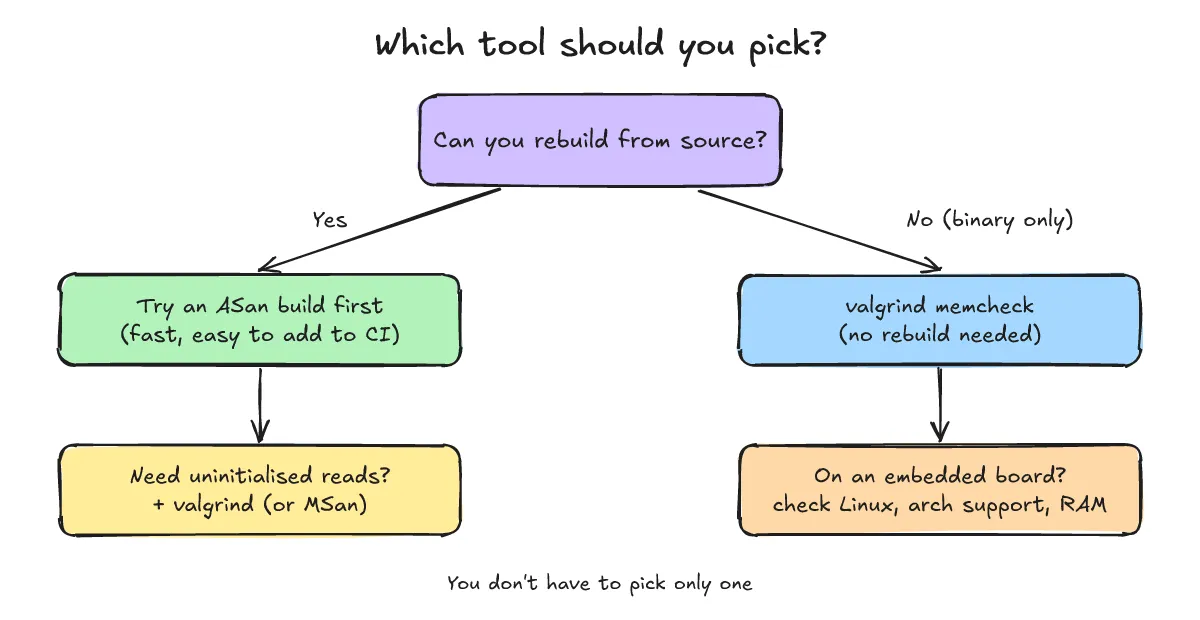
One-line answer: Use ASan (typical 2x slowdown) first whenever you can recompile, and use valgrind (roughly 20 to 30 times slower) when you cannot recompile or when you need uninitialised-read tracking and a full error-and-leak summary in one run.
Here is what happens when we compile and run the exact same leak.c file with AddressSanitizer (ASan):
Actual output (Debian, gcc 14.2.0 ASan, -O0; first 14 lines, addresses vary across runs)
$ gcc -g -O0 -fsanitize=address -fno-omit-frame-pointer -o leak_asan leak.c
$ ./leak_asan
==PID===============================================================
==PID==ERROR: AddressSanitizer: heap-buffer-overflow on address 0x502000000060 at pc 0x556bd471129f bp 0x7ffd7fc4d6d0 sp 0x7ffd7fc4d6c8
WRITE of size 4 at 0x502000000060 thread T0
#0 0x556bd471129e in main /tmp/vg/leak.c:18
#1 0x7f67cf987ca7 in __libc_start_call_main ../sysdeps/nptl/libc_start_call_main.h:58
#2 0x7f67cf987d64 in __libc_start_main_impl ../csu/libc-start.c:360
#3 0x556bd4711100 in _start (/tmp/vg/leak_asan+0x1100) (BuildId: 835c3ecb59641265ff392653a6debb124f0659a0)
0x502000000060 is located 0 bytes after 16-byte region [0x502000000050,0x502000000060)
allocated by thread T0 here:
#0 0x7f67cfc46c57 in malloc ../../../../src/libsanitizer/asan/asan_malloc_linux.cpp:69
#1 0x556bd471125b in main /tmp/vg/leak.c:17
#2 0x7f67cf987ca7 in __libc_start_call_main ../sysdeps/nptl/libc_start_call_main.h:58- Comparing the two runs:
- Stops at the first error: ASan aborts immediately at the first error (
heap-buffer-overflowatleak.c:18, exit code 1), so LeakSanitizer did not report the memory leaks in this run. By contrast, valgrind logs each error and continues running to print the leak summary at exit. - Does not flag uninitialised reads: ASan did not report the uninitialised read at
leak.c:15. As documented in the Clang AddressSanitizer documentation, uninitialised reads are the job of MemorySanitizer (or valgrind Memcheck), not ASan. - Observation on optimisation flags: In this run, compiling the same ASan build with
-O1printed nothing because the compiler eliminated the deadmalloc/write/freecalls. Stick to-O0for small reproduction snippets (for general ASan flags, see our earlier AddressSanitizer post).
- Stops at the first error: ASan aborts immediately at the first error (
| Criterion | valgrind (Memcheck) | AddressSanitizer (ASan) |
|---|---|---|
| Mechanism | Runs existing binary without recompile (-g -O0 recommended for accurate line numbers) | Compile-time instrumentation (-fsanitize=address, requires recompile) |
| Typical slowdown | Much slower—e.g. 20 to 30 times slower than normal (Quick Start; slower still with --track-origins=yes) | Typical slowdown is 2x (Clang ASan docs) |
| Uninitialised reads | Detected (origin tracked via --track-origins=yes) | Not detected (handled by MemorySanitizer) |
| Memory leaks | Reports definitely, indirectly, possibly lost, and still reachable | Includes LeakSanitizer on Linux (skipped in a run if an earlier error aborts the process) |
| Behavior on error | Logs errors and continues running to print the full summary | Stops immediately at the first error (exit code 1) |
| Linux platforms | ARM/Linux (supported since ARMv7), ARM64/Linux (ARMv8), RISCV64/Linux, MIPS32/64/Linux; X86/Linux in maintenance mode (Platforms) | Targets where gcc or clang supports -fsanitize=address |
What should you watch out for on embedded boards?
One-line answer: valgrind only applies to boards running Linux, requires extra RAM on small targets, and is often easiest to run on an x86 host build when hardware-independent logic can be reproduced off-target.
- Linux requirement and architecture support: According to the official Valgrind platforms page, supported Linux targets include ARM/Linux (supported since ARMv7), ARM64/Linux (ARMv8), RISCV64/Linux, and MIPS32/64/Linux, while X86/Linux is in maintenance mode. Bare-metal Cortex-M MCUs without Linux cannot run valgrind—it is strictly for boards running Linux.
- Adding valgrind to Buildroot or Yocto:
- Buildroot: Enable
BR2_PACKAGE_VALGRIND=yin your configuration. - Yocto: Add
valgrindtoIMAGE_INSTALL(for example,IMAGE_INSTALL:append = " valgrind").
- Buildroot: Enable
- Board RAM and host alternatives:
- On small boards, valgrind needs extra RAM, so check free memory before running it on target.
- While running an ARM binary under
qemu-useron the host is sometimes suggested, layering valgrind insideqemu-useris not straightforward. The simplest alternative is to compile and reproduce the platform-independent logic on your x86 host build with valgrind or ASan.
What are frequently asked questions about valgrind?
Q1. Do I have to recompile my program to run valgrind?
No—valgrind runs your existing binary directly without recompilation (Quick Start). However, building with -g (and -O0 recommended for accurate lines) lets Memcheck report exact source files and line numbers such as leak.c:15.
Q2. Should I fix definitely lost or indirectly lost blocks first?
Fix definitely lost blocks first. indirectly lost blocks (such as n->name) are only reachable through a lost parent block (such as struct node *n), so freeing the root block resolves both.
Q3. Why didn't ASan catch the uninitialised variable (int x) read?
AddressSanitizer (-fsanitize=address) catches spatial and temporal memory errors like buffer overflows, not uninitialised reads (Clang ASan docs). Use valgrind --track-origins=yes or MemorySanitizer to detect uninitialised values.